How it works
The Bay Area has famously local weather — Berkeley can be in full sun while Muir Beach is buried in fog. Sunfinder reads a weather satellite directly to show where it is sunny right now, and how far you would have to drive to reach it. These are current conditions, not a forecast.
From satellite to map, in four steps
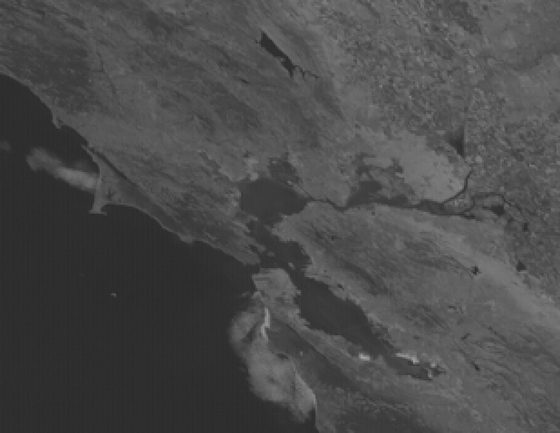
STEP 1 The satellite A raw frame from NOAA's GOES-18, which photographs the western US every few minutes. It arrives tilted, the way the satellite sees it.

STEP 2 The refresh NOAA labels every pixel clear or cloudy. Sunfinder fetches that grid and reads the label at each trailhead — yellow is clear, grey is cloud.
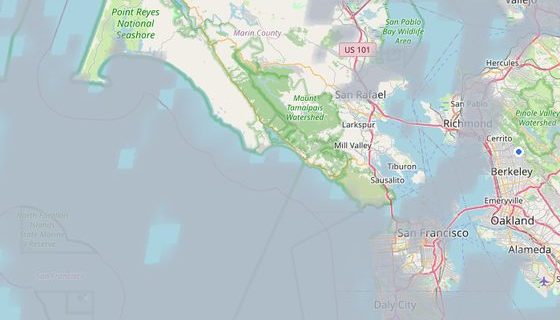
STEP 3 The overlay Each pixel is converted to a real latitude and longitude and drawn over the map. Here fog sits on the coast while the East Bay stays clear.
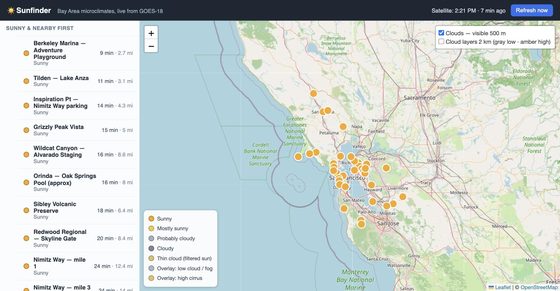
STEP 4 The page Trailheads are listed sunny first, then by how long the drive is — so the answer is the top of the list.
Drive times come from a routing service and are cached per trailhead. Each run also updates what a clear sky normally looks like at each spot, which is used to catch thin fog the satellite label misses.
Notes
- Not a forecastEvery reading comes from a satellite image taken minutes earlier, not from a weather model.
- Cloud cover isn't guessedNOAA classifies each pixel before this app sees it. Sunfinder places that result on the map and reads it.
- Pixels become real placesEach satellite file carries its own projection parameters, so every pixel maps to a true latitude and longitude.
- A second look at fogThin coastal fog can be labelled clear, so a sharper image band is checked before a spot is called sunny.
Stack
Python Flask NumPy netCDF4
Leaflet Docker — satellite data from NOAA GOES-18
on AWS Open Data, basemap from OpenStreetMap. Runs as a Flask blueprint
inside this portfolio app.